AI Solution
Power Price Scenarios
Would you invest 500M€ in a new power plant in Spain? It depends, of course. It depends on its revenue and profits, which are driven by the evolution of the power market.
To help A2A take strategic decisions, we designed and developed a system to simulate the European power market over the next 40 years.
Collaboration
2 years
Technologies
R, Shiny, Python, AirFlow, Google Cloud, cvxpy
Client
A2A
Industry
Energy and Utility


The future of power markets
We wanted an easy-to-use and flexible system, accessible for executives and analysts alike, where all the complexity is hidden from the final users.
The application of the best practices in both data visualization and software engineering was key to the success of the product.


01. Context
Enabling strategic planning
A2A, the third largest Italian utility, wanted to enhance its strategic planning. As their analysts were struggling in developing meaningful long-term scenarios for the European power market, we were asked to develop a solution.
The new system was meant to replace several tools adopted by market analysts, allowing for greater resolution and advanced mathematical modelling.
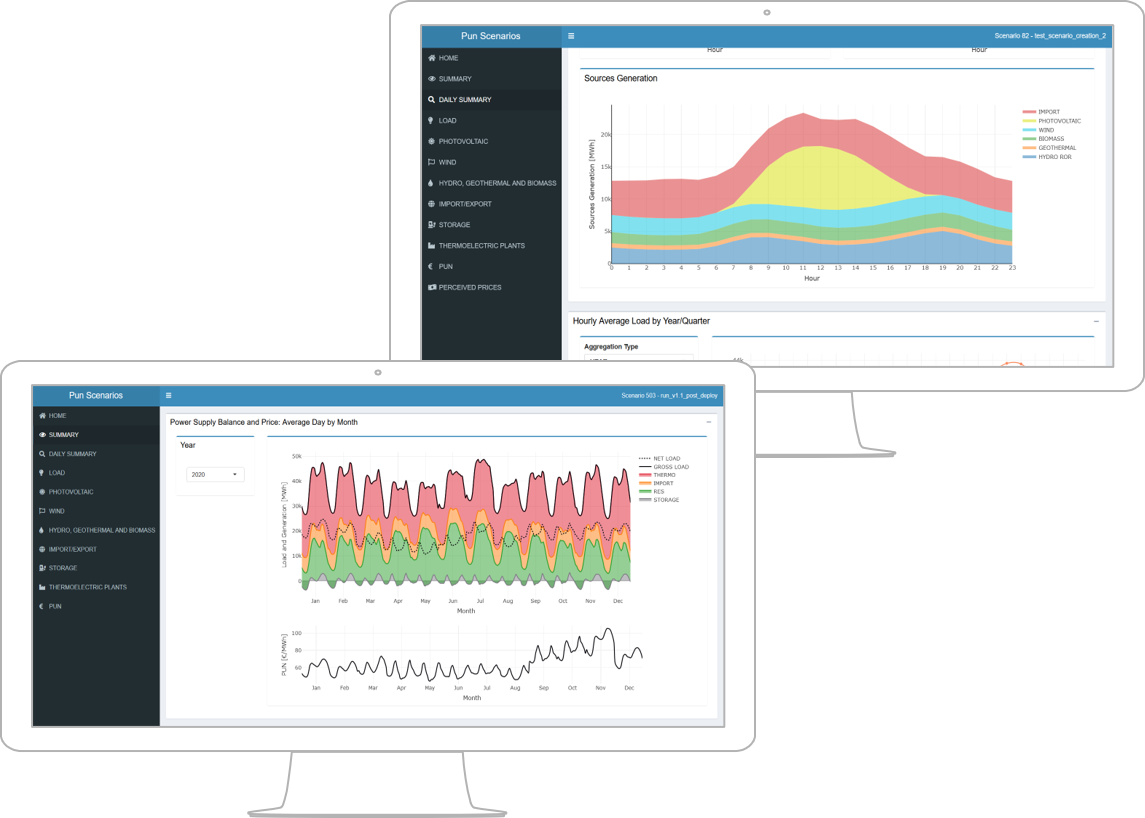
Result visualization was crucial to the success of the platform: the application was to be given to both analysts and executives, so it had to provide simple and accessible overviews while allowing for deep analysis.
02. Solution
R and Python shine together
We stated with a comprehensive analysis of the existing tools and processes, highlighting the limitations and noting where a custom-developed platform could deliver the most value.
Then, we modelled operations required to produce the output of a scenario as a Directed Acyclic Graph and we adopted a cloud-native solution based on Google Cloud Composer and Apache AirFlow. This architecture allows for a flexible structure of the codebase and maintains a loose coupling between individual steps of the processing. Inputs and outputs are stored in Google BigQuery, allowing for a complete reproducibility of each scenario.
The pipeline is triggered and controlled by APIs, while the interaction with the user and the visualization of the outcomes is handled by a dashboard built with R and Shiny and hosted on a GKE cluster.
Comprehensive unit and integrations tests an proper CI were configured for both the pipeline and the dashboard.
03. Achievements
THE RIGHT TOOL IMPROVES THE PROCESS
The new platform completely replaced the legacy tools. It allowed for the adoption of advanced mathematical optimization to model some components of the power grid. It enabled 40-year-long scenarios with hourly granularity, while the previous process relied on 4 days per year for 20 years.
By cutting the effort needed to create a scenario, the new system allowed for a 12x increase in the number of simulations performed each year, enabling the company to take into account several situations.
Much to the surprise of the analysis we collaborated with, the new dashboard resulted so effective in presenting the outputs of the scenarios that other departments in the company started asking for clarifications and for further scenarios to be created.
Like what you see?
If you need something like this, just drop us and message and we will come back to you within two working days.